The following article will provide you with an understanding of how each tile in the dashboard is calculated.
While FlatRateNOW dashboard can provide important information in real-time, it is important to understand how each tile is calculated so you can ensure you are tracking the right information.

Included in the Dashboard page, before the 'My Dashboard' section, you have:
- 4 x tiles
- 1 x Sales Graph
- 2 x time ranges
Here is how each tile is calculated:
Date Range Filter:
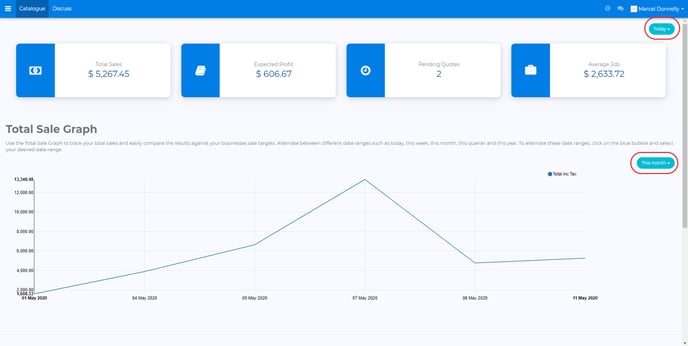
The Date Range Filter has a list of pre-set date ranges you can alternative between to track each of the 4 tiles.
Total Sales Tile:
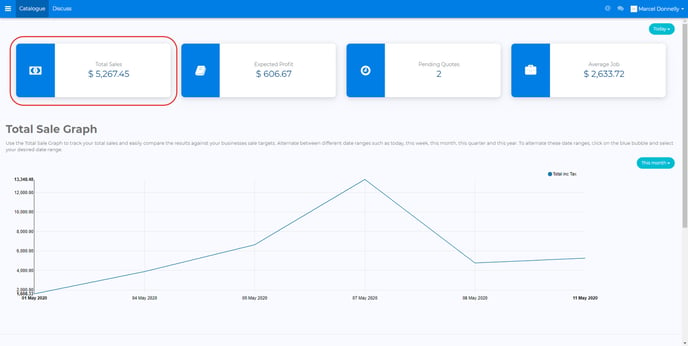
The Total Sales tile is the sum of all accepted quotations within the chosen date range. Use this metric to track against your expected sale targets.
Expected Profit Tile:
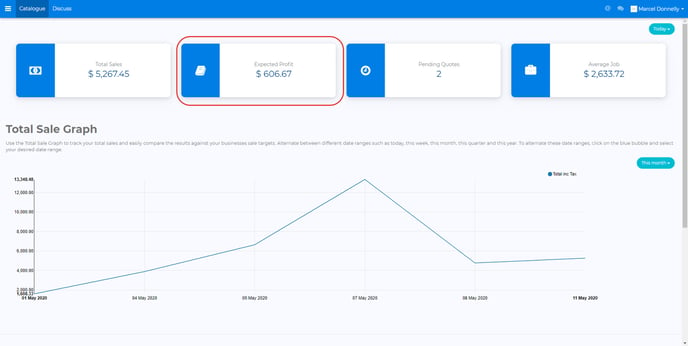
The Expected Profit tile is the sum of the expected profit on all accepted quotations within the chosen date range. This metric is extremely important as low expected profit leaves no room for error.
Pending Quotes Tile:
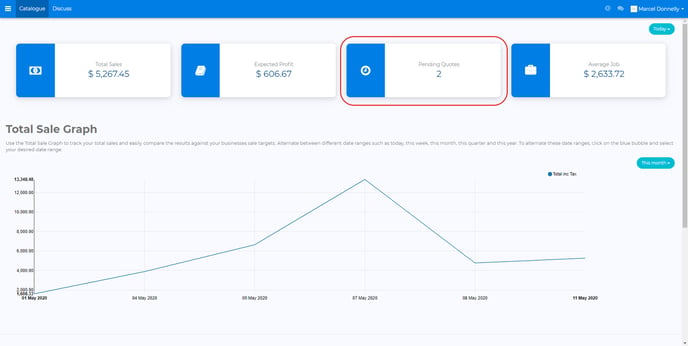
The Pending Quotes tile highlights the number of quotes with a status of 'Pending' within the chosen date range. This metric is important and can be used to improve the success of your businesses. A high pending quote number could be an indication that you are not converting jobs.
Average Job Tile:
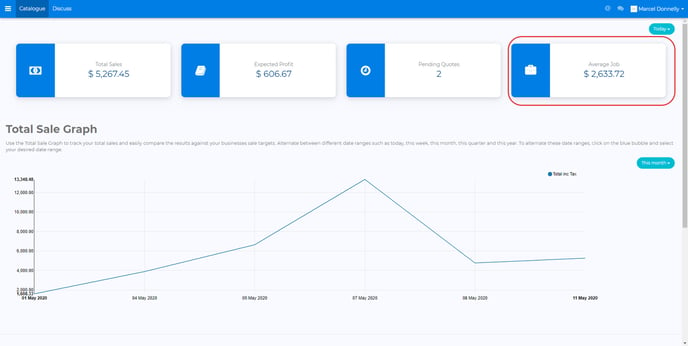
The Average Job tile calculates the average value of your accepted quotations within the chosen date range. This metric is important to understand as a low average job value will require a significant number of jobs to achieve expected sale targets.